Edit
In the "Edit" section, users have access to a comprehensive set of tabs that cover various aspects of their testing process. These tabs include:
-
General Users can provide a description for the test, allowing them to add context and information about the test setup.
-
User Parameters This tab allows users to input and customize parameters specific to their testing needs.
-
Specimen Users can define specimen-related details and characteristics in this tab.
-
Measurements This section is for configuring and monitoring measurements during the test.
-
Test Procedure Users can set up the step-by-step procedure for the test, specifying actions and conditions.
-
Results Here, users can view and manage test results and data.
-
Statistics Users can access statistical tools to analyze test results and obtain insights.
-
Live Display This tab provides a real-time display of the ongoing test, helping users monitor progress.
-
Diagrams Users can create and visualize diagrams related to the test.
-
Report This tab assists in generating comprehensive test reports for documentation and sharing.
-
Close-Series Settings Settings for managing and configuring test series, if applicable.
-
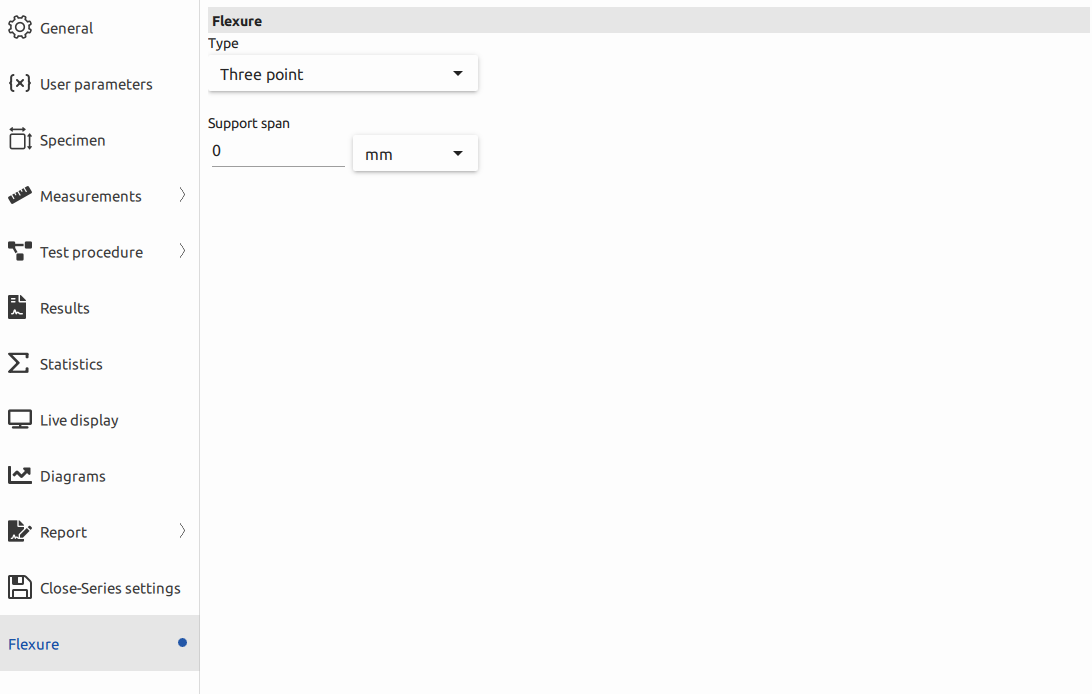
Flexure Specific settings for flexure testing procedures.
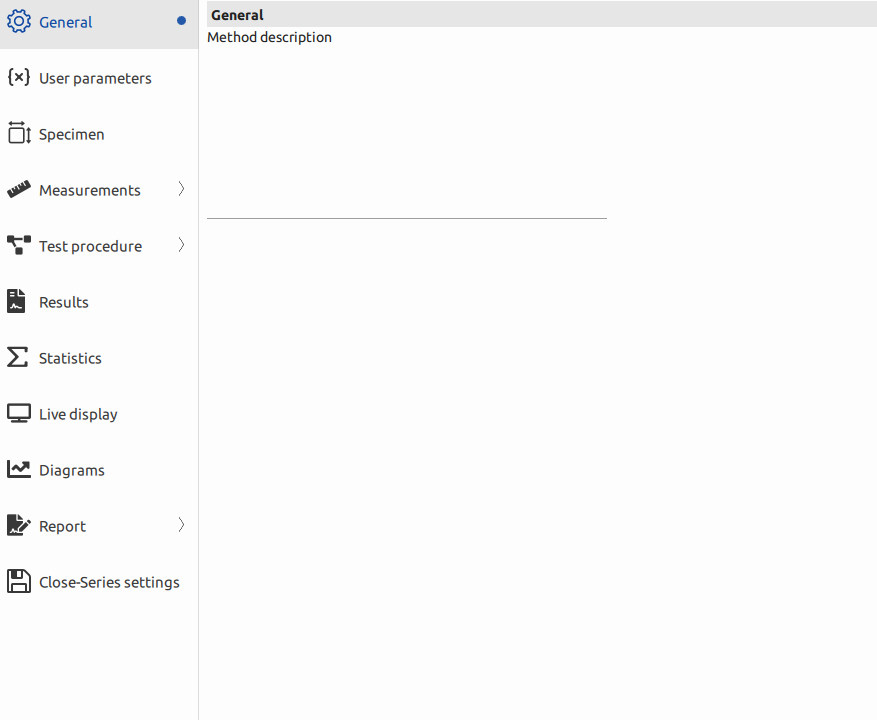
Within the "General" tab, users have the option to enter a description for the test. This feature serves to enhance documentation and provides a convenient way to provide additional context and information about the test setup.
General
The general methods section is the space to articulate the overall approach to conducting material tests. Users should follow the outlined procedures to ensure accurate and reliable results.
Procedure:
- Setup: Ensure the testing machine is properly calibrated and the specimen is correctly positioned.
- Configuration: Adjust user parameters and specimen details in their respective tabs.
- Initiate Test: Click on the appropriate buttons to start the test, ensuring that sensors and measurements are accurately recorded.
- Monitoring: Keep an eye on real-time measurements and adjust settings as needed during the test.
- Analysis: After the test, review measurement data in the "Measurements" tab and analyze results.
User Parameters
In the "User Parameters" tab, users have the capability to add various types of parameters to customize their testing procedure. To see more detail click here.
Specimen
In the "Specimen" tab, users can conveniently input the size data for their samples, providing essential information about the specimen under test. To see more detail click here.
Measurement
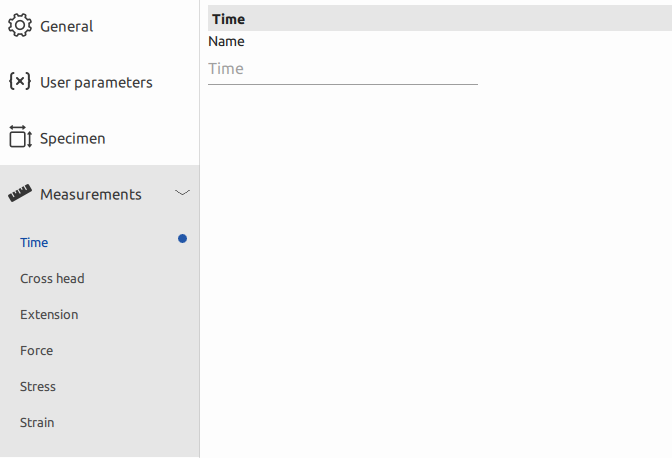
The "Measurements" section is a critical component of the application, providing users with a comprehensive overview of all active sensors and parameters utilized in the instrument. This information is sourced from the controller in the form of raw sensor data or employs pre-defined values available in the calculations menu. While some sensors are derived directly from the controller, others can incorporate constant calculation parameters. Moreover, users have the flexibility to create custom formulas to suit their specific testing needs. In the default tensile template menu, there are six pre-defined formulas available. To customize these formulas, users can simply change the name associated with a formula. Once this change is made in the "Name" tab, the new formula name will appear at the top tab, highlighted in yellow. This enables users to organize and label their formulas for easy access and management, which proves especially valuable when revisiting test files with renamed formulas.
Here's a description of the various measurements commonly associated with material testing machines:
-
Time
Time measurement is fundamental in material testing. It tracks the duration of the test, capturing how materials behave under stress over time. This measurement helps in assessing factors such as material creep, fatigue, and time-dependent properties.
-
Cross Head (Displacement)
Cross head or displacement measurement monitors the movement of the testing machine's crosshead, which holds the specimen. It records how much the specimen deforms or stretches during the test, providing insights into its elasticity and deformation behavior.
-
Extension (Deformation)
Extension measurement specifically focuses on the deformation of the material being tested. It quantifies the change in length or dimensions of the specimen as it undergoes stress. Extension data is crucial for determining material properties like elongation and strain.
-
Force:
Force measurement is central to material testing machines. It quantifies the applied load or force on the specimen. This measurement is essential for evaluating properties such as tensile strength, compression strength, and yield strength.
-
Stress
Stress is calculated as the force applied to the specimen divided by the original cross-sectional area. It measures how much force a material can withstand before deforming or breaking. Stress data is crucial for material design and structural analysis.
-
Strain
Strain measures the deformation of a material relative to its original length or dimension. It's often expressed as a percentage change in length. Strain data is essential for understanding how materials respond to external forces and for calculating properties like Young's modulus.
These measurements are integral to material testing machines and provide critical data for characterizing the mechanical behavior and properties of materials, which is essential for a wide range of industries, from manufacturing to aerospace to civil engineering.
Additionally, the "Pretest" option offers the capability to enable preload, allowing users to configure settings for speed control and destination control. This empowers users to define the exact conditions under which the specimen undergoes preloading, ensuring precise control and accurate testing procedures.
Test Procedure
In the "Test Procedures" section, users can access various subtabs, each serving a specific role in the testing process. To see more detail click here.
Results
In the "Results" tab, users have the option to add various measurements and metrics to the test results, enhancing the depth and breadth of data analysis. To see more detail click here.
Statustics
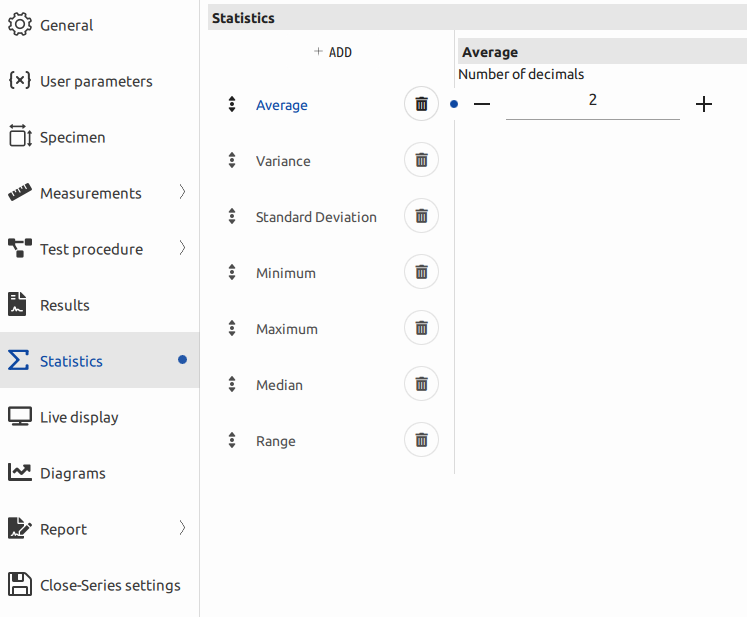
The "Statistics" subtab provides users with valuable tools for data analysis. Users can add the "median" to calculate the average of test results. Additionally, the subtab offers the convenience of automatically calculating essential statistical metrics, including the average, variance, standard deviation, minimum, maximum, and median. These calculations assist users in summarizing and understanding the test results, allowing for comprehensive data analysis and reporting. This feature simplifies the process of deriving meaningful insights from the collected data and streamlines the reporting of key statistical measures.
Live Display
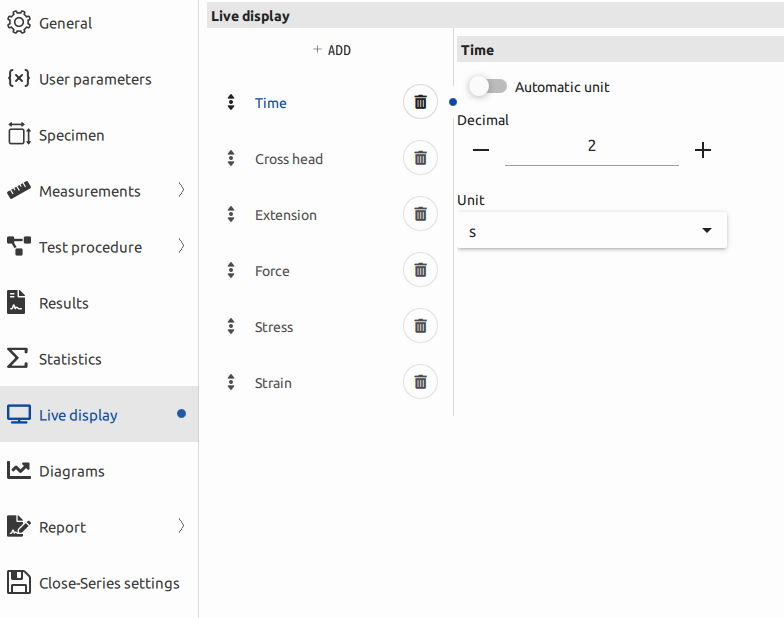
In the "Live Display" subtab, users have the capability to view real-time data for various measurements, including time, cross head, extension, force, strain, and stress. This feature provides users with instant access to critical information during the test, allowing them to monitor and analyze the specimen's behavior as the test progresses. Real-time data visualization is invaluable for making immediate decisions, ensuring the test is proceeding as intended, and responding to any unexpected developments. It enhances the user's ability to maintain control and gather insights throughout the testing process.
Each part of the live display offers users immediate access to critical data, enabling them to monitor the specimen's behavior, assess its performance, and make informed decisions during the test. This real-time information is essential for ensuring the test proceeds as intended and for reacting to any unexpected or anomalous results.
Diagrams
The "Diagram" tab offers users a powerful and flexible tool for creating various diagram combinations by customizing X and Y axes with different parameters. This feature provides extensive possibilities for visualizing and analyzing test data. To see more detail click here.
Report
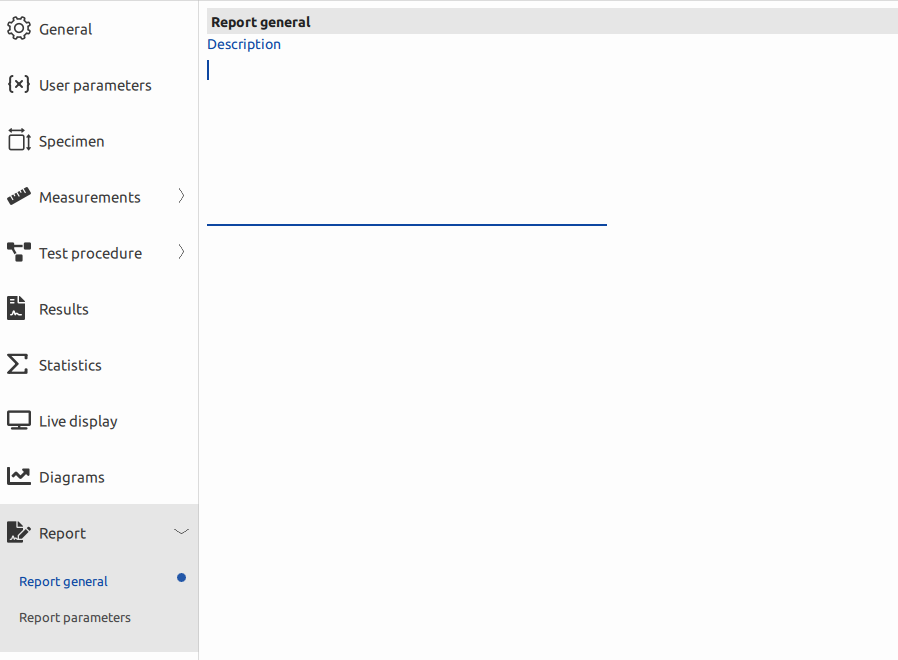
In the "Report" subtab, specifically within the "Report General" section, users have the option to provide a description for their reports. This description serves as a summary or brief statement that adds context and information to the report, making it more informative and useful to the audience. Users can enter a description that encapsulates the main points and purpose of the report they are generating. This feature enhances the quality and clarity of the report, ensuring that readers can quickly understand its content and objectives.
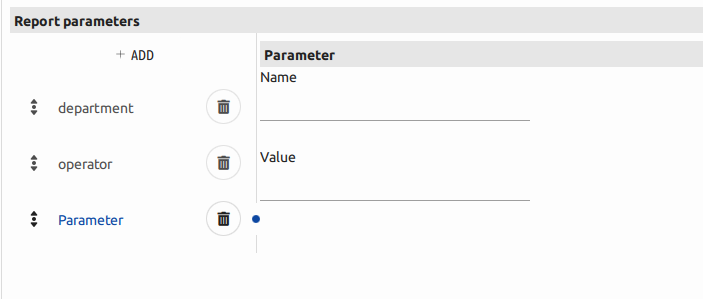
In the "Report Parameters" tab, users have the capability to add various parameters with custom names such as operator, brand number, department, and more. This feature allows users to define and include specific information and metadata in their reports. The flexibility to add parameters in a limitless manner empowers users to customize their reports to suit their unique needs and requirements. These parameters can include details such as operator names, equipment identification, department names, and any other relevant information that enhances the comprehensiveness and context of the report. This feature ensures that reports are highly informative and well-tailored to the specific use case or audience.
Close-Series Settings
In the "Close Series Setting" subtab, users can configure various options that affect what happens after a test series is completed. Here's an explanation of the key options:
-
Generate Name Automatically
This option automates the process of naming the test series. After the test series is finished, the software generates a name automatically, which can be based on predefined rules or a naming convention. This ensures that each test series is easily identifiable and organized in the system.
-
Save Series
Enabling this option ensures that the test series is automatically saved after it's completed. This helps with data management and archiving, ensuring that test results are securely stored for future reference or analysis.
-
Print Report:
By selecting this option, the software will automatically initiate the printing of a report immediately after the test series is finished. This streamlines the reporting process, providing a hard copy of the results for documentation or sharing without the need for manual intervention.
These options in the "Close Series Setting" subtab improve efficiency and organization by automating post-test tasks, ensuring that test data is named, saved, and reported in a consistent and convenient manner.
Flexture
Three-Point Flexure: In this setup, the material specimen rests on two supports or anvils, with a force applied at the center, causing the specimen to bend. This test measures factors like modulus of rupture and flexural strength.
Four-Point Flexure
Here, the specimen rests on four supports with two forces applied on the outer supports, creating a bending moment. This type often allows for more uniform stress distribution along the specimen.
Support Span
The support span refers to the distance between the supports upon which the specimen rests during the test. It significantly influences the stress distribution across the specimen. A longer span might lead to different stress profiles compared to a shorter one.
For instance, in a three-point flexure test, the distance between the outer supports can significantly affect the measured properties like flexural strength. Similarly, in a four-point test, the span impacts how the bending moment is distributed.
Practical Considerations
- Stress Concentration: A shorter span often results in higher stress concentration near the point of force application.
- Uniformity: Longer spans tend to distribute stress more uniformly across the specimen.
